LM3 - C4 - Pricing
LO

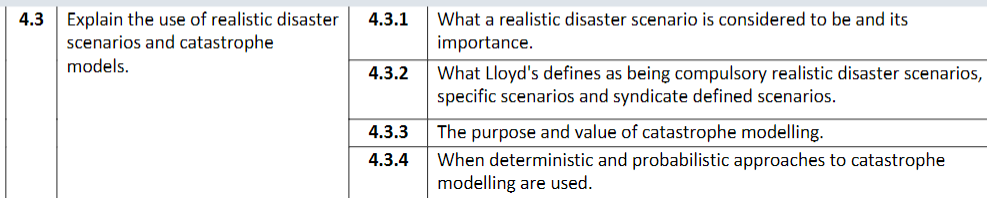
RDS and importance
Lloyds defined compulsory RDS + Syndicate defined scenarios
Purpose + value of CAT modelling
deterministic and stochastic approaches to CAT modelling
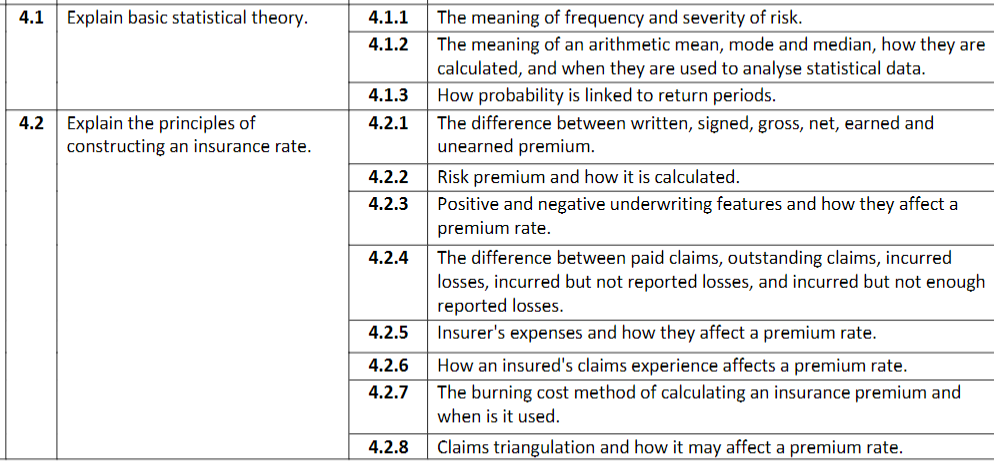
4.1 Statistical Theory in Underwriting
Past Experience - individual perspective + Insurers collective knowledge + Market dynamics
4.1.1 Frequency & Severity of risk
How often VS How extensive
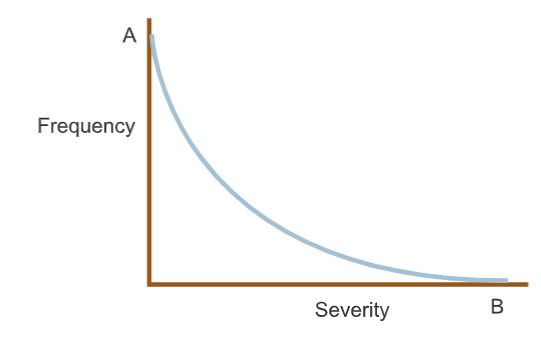
Low frequency don't provide same quantity of data
Attractional: High frequency low severity
Large: Mid frequency mid severity
CAT: Low frequency high severity
4.1.2 Arithmetic Averages
- Mean - Adding all values divided by total number of individual values
- Median - Arrange values in ascending order find 1 exactly halfway, if even take mid point
- Mode - Values most frequency in a set of data.
- BEST WHEN LARGE OUTLIERS ie large vs small claims
- Mode ignores edge cases compared to median
- Expression of preference / time taken to perform tasks
Variance in Data
"Normal distribution"
Standard deviation, volatility (Predictable) underwriters should price this in
Stable and predictability
Frequency distribution
Average time to settle
4.1.3 How Probabilities are linked to Return periods
The law of large numbers
How likely is it to happen?
Option 1: Where all the outcomes are known and all equally likely, e.g. choosing a particular card from a pack or throwing a six using a die.
Option 2: Uses the concept of relative frequencies
OR expressed in bands as figures
"how many collisions a ship owner has as an overall percentage of all the ship’s losses" or "fire" related losses ext... SUM to 100%
Option 3: Uses subjectivity as the underwriters (Experience).
Return periods:
Probabilities in that they are used to express how often a particular event is expected to occur, e.g. a certain severity of flood.
remain the same!!!
A once every ten years has a 0.1 or 10% chance of happening in any one year.
Problems occur when event happen with greater frequency than expected!
Protection from Less frequent/more CAT event
Understand reinsurance program BACK to FRONT
Importance on the capital of the BOOK
"stochastic models based on larger datasets to generate a large number of scenarios"... consider how claim frequency, timing and values
What can the BOOK handle!!!
Interpretation and use of statistics
Historic data losses value if:
- Primary business to writing excess business
- Widening or Narrowing Cover
- New territories
- Risk type
Client Data
Know the Client.
- What is the client’s reality?
- Is business difficult for them?
- Might that mean that savings will be made on routine maintenance, thus creating a greater exposure for the insurers?
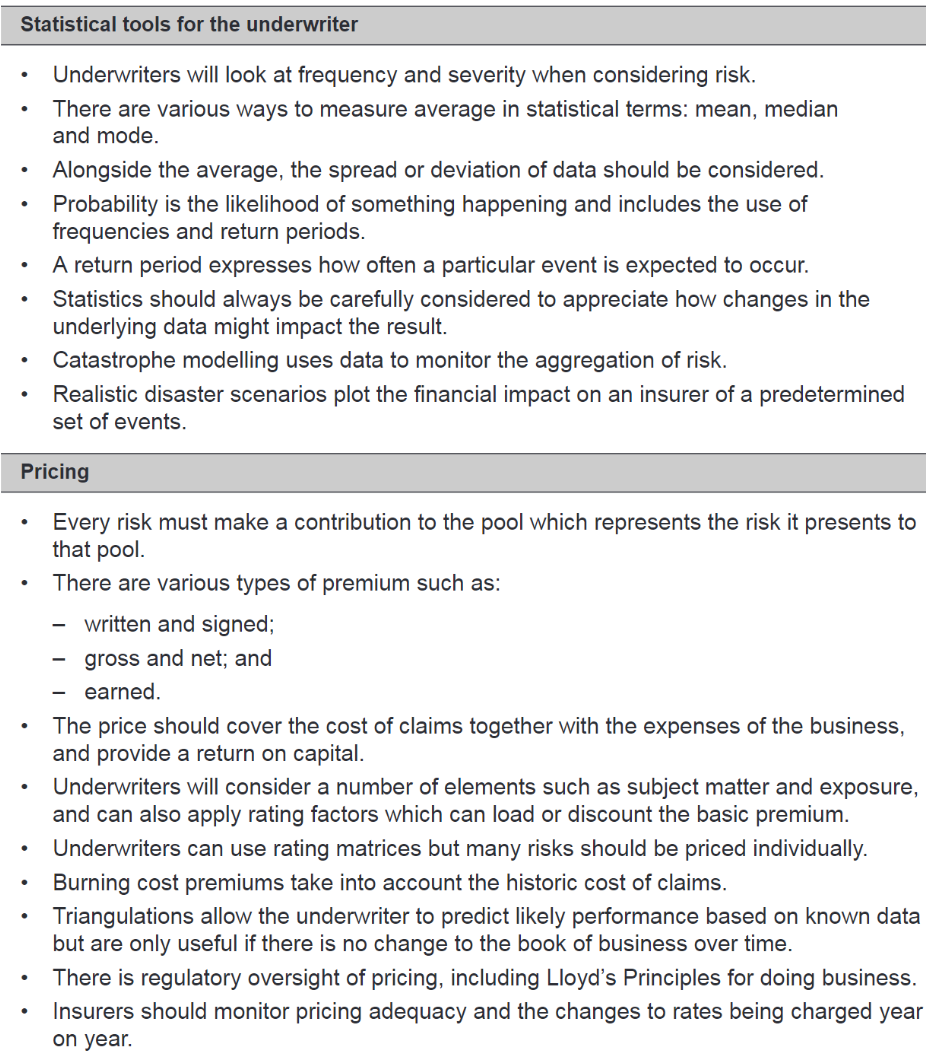
4.2 Principles in constructing an Insurance Rate
Common pool represents the degree of risk they bring and that is fair?
4.2.1 Written, signed, Gross, Net, Earned and Unearned Premium.
Written premium: Premium before deductions (Charged to client/Income section)
==Signed Premium: Signed proportion premium before deduction==
Gross Premium: Signed Premium before deductions or reinsurance
*Net Premium: Gross Premium less deductions*
Earned Premium: Premium Earned during policy period or "LIVE" for reserving. (Assume linear BUT CLASS dependent)
Incurred Losses: Total paid losses and outstanding loss reserves
Premium for the risk including loading for expenses or costs of acquisition.
-
Risk Premium
-
Expenses of the business
-
brokerage, commissions,
-
Return on capital
4.2.2/3 Risk Premium cover the cost for losses!
- Claims might arise some time in the future subject to inflation (RPI base + escalation).
- Liability classes are long tail (Can close quickly) vs short tail PD/property
Frequency and severity for different types of potential claims
- What is insured:
- What physical assets being insured
- Liability - Risk separately Tort-based liabilities is involuntary vs contractual liabilities is voluntary
- Size and Exposure:
- Solar: Value, construction method, Business Income, Management, headcount
- Insureds determine IF Cat Event results in Total loss of Insured Property + Other Perils eg Fire or Theft lead to large loss. Will limit be used?
- Scope of cover/being offered
- What is being offered? Have insurers not taken into Consideration? High or low excess? How changes made today affect consideration of historic claims data?
- Particular rating factors (Loading/Discounting)
- Property - Hazard location, risk mitigation, Age, size of deductible
- Liability - Good practices/training, Type of work at a location or role in office?
- Historic claims experience and Cat Claims
- If not data available use Cat modelling.
- Also Currency fluctuation during inception and claims date.
- Unknown market changes (Miss factors)
- Changes in the law
- Changes in Climate
- Overall State of the economy
- Liability reinsurance classes will have indexation provisions built into them, whereby the effect of inflation when a claim takes a long time to resolve is shared between the cedant and the reinsure.
- Emerging risks = Cyber
WHYS IS Insurer's acquisition costs and required return on capital
Rating models
Generic risk data and rating parameters
Feed Known information about individual risk into a framework
Consider number of variables OUTPUT a rate for the risk.
4.2.4 Paid claims, Outstanding, Incurred losses, IBNR and IBNER
- Paid claims: Claims or portions of claims that the insurer has already paid.
- Outstanding claims: Reserves for claims that have been incurred but have not yet been paid. These reserves may include estimates for known claims, IBNR, and IBNER.
- Incurred losses: The total of paid losses plus outstanding loss reserves:
Incurred losses = Paid claims + Outstanding claims.
-
IBNR — Incurred But Not Reported: A reserve for claims that have already occurred but have not yet been reported to the insurer.
-
IBNER — Incurred But Not Enough Reported: An additional reserve for known claims where the existing reserve is not expected to be sufficient to cover the ultimate settlement amount.
4.2.5 Insurer's Expenses & how they affect Premium Rate
Expenses: Staff , Regulation, Overhead, Office space, Lloyds fee
Electronic placing and cost reduction: Acquisition + operating cost
can pull specific info from white json?
4.2.7 Burning cost for premium rate and when is it used!
Minimum premium set by insurers + Technical price for a risk.
- Over-supply of insurers will force down price
- How to price less then competitors + Justifiable and Run without a loss.
- How will you meet business plan?
- Is renewal business cheaper than New Biz on an Aqc basis?
Burning cost - Paying losses over a period of time
AMOUNT of PREMIUM in paying losses over a period of time.
Using past claims data of values that don't change much.
Inflation factor?
Covered offered
- Analyse claims data and project ULTIMATE NET LOSS for any YOA
- Index historic claims to current day values
- Factor in POTENTIAL for LARGE LOSSES
- Emerging Risk, trends in data
- If limit is increased from $2m to $10m. Claims losses value. THEREFORE CHARGE additional premium! low-frequency, high-severity exposure
4.2.8 Claims Triangulation and how it may affect Premium rate
Only work if no change in underlying risks or legal framework. Need to compare APPLES TO APPLES (Construction premium and paid claims triangulations).
Read across to estimate YOA future claims expectation based on previous years percentages.
Triangulation uses PAID claims figures. But other elements needed for Reserving number FOR YET to BE PAID CLAIM:
- Raised on claims on the basis of Known information on known claims
- IBNR = Claims reported late "padded/fat" so enough is available. & Burn against benchmark!
- IBNER = Claims known but RESERVED entered NOT high enough to cover ultimate settled amount
Other Concepts!
Profit and Return on Capital Employed (ROCE)
Measures how well company is generating profits from its capital.
Claims + Expenses Net of Reinsurance <100% of premiums therefore VE + combined ratio
Healthy companies:
Set aside for Capital reserving + dividends
Pros and cons of underwriting strategy
focus on investment incomes deplete claims slowly
Regulatory oversight of pricing
Setting realistic pricing which are justifiable and support business plan.
Principle 1 - Underwriting profitability
Sub-Principle 6 – have an effective pricing framework in place in order to evaluate sustainable technical price, rate adequacy and deliver sustainable profit.
Evaluate sustainable technical pricing
Rate adequacy
deliver sustainable profit
Risk Appetite: Make a return on capital! (baked in ULR)
Region providing enough premium?
Pricing policy sets out how pricing is carried out for risks, SUPPORTS business plan, managed across the cycle... Causes TP to below 100%!!!
Return period discussion
(Brokerage, admin fees, to calculate adequate rate)
Pricing methodology
taking into account Claims:
Attritional
Large
Cat
Pricing decision = 1. experience or 2. exposure data (benchmarks or judgements)
Rational needs to be tracked
Validation of models!!!
Peer reviews done of pricing decisions
Pricing adequacy + rate change management/monitoring
Adequacy of prices + changes in rates charged on a risk between 1 year and another.
Lloyds Monthly Performance management Data Return:
- premium volume summary, including acquisition costs;
- new risks, including both the benchmark and actual price;
- renewed risks, including the changes in pricing on renewals; and
- non-renewed risks.
Gradually increasing premium towards the Target Price
Year on Year risk performance
Renewables Example of Risk Adjusted Rate Change
Hotel example... consider TOP3 sites RARC
Price & Rate Monitoring, Audit and Review
Independent reviewers, actuaries, business planning
checks should be done (usually by actuaries) to ensure that the pricing models are being used appropriately.
...
4.3 RDS and Cat modelling
Deterministic vs probabilities
Deterministic calculations take one value for each of those parameters for a set level of probability and will provide one answer, so for example when thinking about the actual maximum loss, you would take high values for each.
probabilistic approach uses a spread of variables for each parameter and therefore produces a spread of likely outcomes, which can then be analysed using (averaging and standard deviations) stochastic tools
CAT modelling RDS
EML of a site is X
Reinsurance
Key Points